
Technical Readiness
Core Web Vitals explained for marketing teams: what to fix first
Core Web Vitals are three measures of how real visitors experience a page. What LCP, INP and CLS mean, how much they count for Google, and what to fix first.

Summarize with AI
Short on time? Open this article in your AI assistant with a ready-made prompt.
- ChatGPT (opens in a new tab with a summary prompt)
- Perplexity (opens in a new tab with a summary prompt)
- Grok (opens in a new tab with a summary prompt)
Claude and Gemini open with the prompt copied: paste it to start.
On this page
- What are Core Web Vitals, in plain words?
- Do Core Web Vitals affect Google rankings?
- Why does the lab score disagree with the report?
- Which metric fails most often, and why?
- What should you fix first?
- What does a marketing team gain from fixing them?
- Do Core Web Vitals matter for AI search engines?
- How does ContentMas help with Core Web Vitals?
- Key takeaways
- Frequently asked questions
Short answer
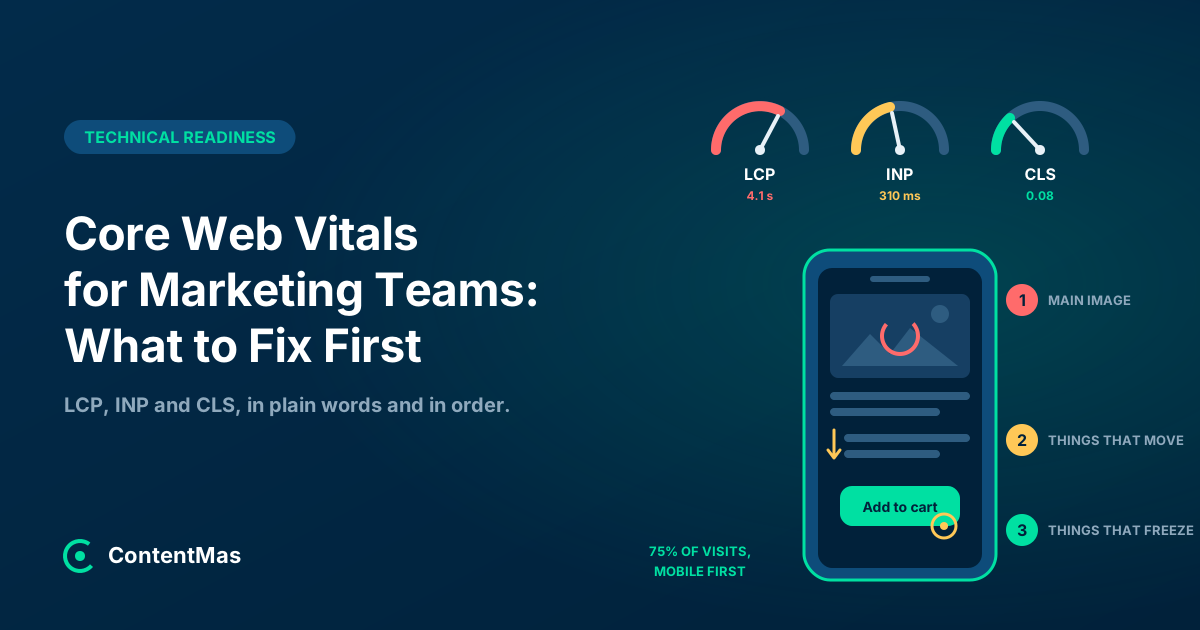
In short: Core Web Vitals are three measurements of how real visitors experience a page: Largest Contentful Paint (how fast the main content shows), Interaction to Next Paint (how fast the page reacts to a tap) and Cumulative Layout Shift (how much the layout jumps). Google counts a page as good when 75% of its visits reach 2.5 seconds, 200 milliseconds and 0.1 or better,1 says the metrics "are used by our ranking systems," and in the same document warns that good scores do not guarantee top rankings.2 In 2025, 48% of mobile websites and 56% of desktop websites passed all three,3 and the metric that fails most often is LCP, usually because of one image at the top of the page.43 For most marketing teams the order of work is: the main image first, then the server, then the elements that move, then the scripts that freeze a tap.
The email from Search Console says "Core Web Vitals issues detected." The developer runs a test and says the page scores 94. The agency says speed is a ranking factor. Nobody can tell you which number Google uses, or what would change if it improved. This guide is for the people who own the website's results, not its code.
What are Core Web Vitals, in plain words?
Three numbers, each describing a moment a visitor notices. Google defines them as "a set of metrics that measure real-world user experience for loading performance, interactivity, and visual stability of the page."5
| Metric | What it measures | Good | Poor | What the visitor feels |
|---|---|---|---|---|
| Largest Contentful Paint (LCP) | Time until the largest visible element (usually the main image or headline) is on screen | 2.5 s or less | over 4 s | "The page is still loading" |
| Interaction to Next Paint (INP) | Delay between a tap, click or key press and the screen responding, across the whole visit | 200 ms or less | over 500 ms | "I tapped and nothing happened" |
| Cumulative Layout Shift (CLS) | How much visible content moves while the page loads, as a score | 0.1 or less | over 0.25 | "The button jumped and I hit the wrong thing" |
The thresholds are Google's.1 Two details decide whether a page passes. First, the number is taken at the 75th percentile: Search Console describes group LCP as "the time it takes for 75% of the visits to a URL in the group to reach the LCP state."1 A page can be fast for most people and still fail because a quarter of its visitors, on older phones or slower connections, are kept waiting. Second, mobile and desktop are judged separately,1 and most sites that fail do so on mobile.3 The numbers come from real visitors, not a test machine: the report is "based on real world usage data (sometimes called field data)."1
Do Core Web Vitals affect Google rankings?
Yes, as one signal among many, and less than most agencies imply. Google's page experience documentation answers directly: "Core Web Vitals are used by our ranking systems," and "Beyond Core Web Vitals, other page experience aspects don't directly help your website rank higher in search results."2 It also sets the limit: "Google Search always seeks to show the most relevant content, even if the page experience is sub-par."2
The same page tells site owners not to over-invest. Good results in Search Console "doesn't guarantee that your pages will rank at the top of Google Search results," and "trying to get a perfect score just for SEO reasons may not be the best use of your time."2 So relevance and content quality decide whether a page competes at all; among pages that compete, one that keeps visitors waiting or jumping carries a handicap. The business reason, covered below, is usually stronger than the ranking reason.
Why does the lab score disagree with the report?
Because they measure different things, and marketing teams tend to read the wrong one. The score out of 100 in PageSpeed Insights is lab data: "The lab data is based on a simulated load of a page on a single device and fixed set of network conditions."6 It is a diagnostic for developers, not what Google judges.
The Core Web Vitals assessment at the top of the same page is field data. It is "powered by the Chrome User Experience Report (CrUX) dataset," covers "the previous 28-day collection period," and "passes the Core Web Vitals assessment if the 75th percentiles of all three metrics are Good."6 That is the number Search Console shows, and the one that belongs in a monthly report.
Search Console adds grouping. "URLs in the report are grouped into pages that have a similar user experience," and a group's status is "its most poorly performing metric."1 One slow template, such as the product page, can turn hundreds of URLs red at once; one fix turns them green together. After a fix, allow time: validation "(re)starts the clock on a 4-week monitoring period of CrUX data for your site."1
Which metric fails most often, and why?
LCP, by a wide margin, and the cause is usually an image. Among mobile websites measured by the HTTP Archive in July 2025, 62% had a good LCP, against 77% for INP and 81% for CLS.3 Chrome's monthly dataset for October 2026 tells the same story across 18 million origins: 68.8% had good LCP, 81.6% good CLS, 85.2% good INP, and 56.3% passed all three.7
The reason is structural. "Images continue to dominate LCP elements across both device types, with 85.3% of desktop pages and 76% of mobile pages having an image as their LCP element,"3 so the metric usually comes down to one file: the hero image, the product photo or the article cover. That file is often handled badly: "about 16%-17% of pages lazy-load their LCP image," while fetchpriority="high", the attribute that tells the browser to fetch it first, appears "on 17% of mobile pages with LCP images."3 The "majority of origins with poor LCP spend less than 10% of their p75 LCP time downloading the LCP image."4 The image is not slow. The browser finds it late.
INP is the one to watch, because it is moving the wrong way. The share of origins with good INP slipped from 87.2% in March 2026 to 85.2% in October, and the Chrome team wrote in August that "The continued regression of INP in particular is a cause for concern, but we don't have a definitive reason for this."7 More scripts, more tags, more frameworks.
What should you fix first?
In the order below. Google's list of "the most realistic and impactful ways you can improve your Core Web Vitals metrics" is the source for most of the fixes.4
1. The main image (LCP)
Open the failing page on a phone. The hero image, product photo or cover is almost always the LCP element.3 Three things go wrong with it, and all three are cheap to fix.
It is lazy-loaded. Google is unambiguous: "Never lazy-load your LCP image, as that will always lead to unnecessary resource load delay."8 Many themes and image plugins add loading="lazy" to every image, including the first; remove it from that one.4
It is not prioritized. "Add the fetchpriority="high" attribute to the <img> or <link rel="preload"> tag of your LCP image."4 One attribute, present on only 17% of the pages that need it.3
It is not in the HTML. Google says "your LCP resource should be discoverable from the HTML source";8 sliders, background images set by JavaScript and testing tools that swap the hero after load all break this.
2. The server (LCP again)
If the image is right and LCP is still slow, the page itself arrived late. "A high TTFB can make achieving a 2.5 second LCP challenging, or even impossible,"8 and in 2025 only 44% of mobile websites had a good time to first byte.3 Two causes dominate. Redirects: "A common cause of a slow TTFB for an otherwise fast site is visitors arriving through multiple redirects,"8 which is what happens when a campaign link goes to http://, then https://, then www, then the page. Distance: Google recommends a CDN, and notes that "only 33% of HTML document requests were served from a CDN."4
3. The things that move (CLS)
Scroll a page on a phone while it loads; if the text jumps when an image, banner or ad appears, that is CLS. The main cause is content loaded without a reserved size: "On mobile, 62% of pages fail to set dimensions on at least one image."3 Google's fix is to "explicitly set width and height attributes or their equivalent CSS properties" and to reserve space for anything injected later, such as ads, embeds and cookie banners.4
4. The things that freeze (INP)
A visitor taps "Add to cart" or opens the menu, and nothing happens for half a second. The cause is JavaScript busy with something else: "When a task exceeds 50 milliseconds in duration, it becomes a long task," and long tasks "can block the main thread from responding quickly to user interactions."4
This is where marketing is often the cause. Google's advice has a line aimed at exactly this reader: "If you're using a tag manager, periodically optimize your tags. Older tags with unused code can be removed to reduce your tag manager's JavaScript footprint."4 Chat widgets, heat maps, pixels and old experiment scripts run on the same thread as the "Add to cart" button.
| Step | Metric | Usual cause | Owner | Time |
|---|---|---|---|---|
| 1 | LCP | Hero image lazy-loaded, not prioritized or not in the HTML | Developer | Hours |
| 2 | LCP | Slow server, redirect chains, no CDN | Host or developer | Days |
| 3 | CLS | Images, ads, banners and embeds without a reserved size | Developer | Days per template |
| 4 | INP | Too many tags and scripts, long tasks, very large pages | Marketing and developer | Ongoing |
What does a marketing team gain from fixing them?
Usually more of the conversions the pages already earn, which is a more reliable return than rankings. The clearest recent example is Nuvemshop, a Latin American e-commerce platform, published with Google in June 2026. Its "Largest Contentful Paint (LCP) health improved 68%, from 57% to 96% in one year," its "Core Web Vitals pass rate jumped from 48% to 72%," and across the same stores it measured an "8.9% increase in conversion rate (session-to-paid-order)."9
What it did matches step 1 above: it "Removed lazy loading from images at the top of the viewport" and "Added explicit priority signals" with fetchpriority="high".9 The method was a year-over-year comparison of "the same cohort of Brazilian stores active in Jan 2025 and Jan 2026,"9 so other changes contributed too. Treat the figure as an order of magnitude, not a promise.
Do Core Web Vitals matter for AI search engines?
Not as a lever, as far as the available data shows. The one sizeable analysis published so far looked at 107,352 pages that "appear prominently in Google AI Overviews and AI Mode." For LCP "the correlation ranged from -0.12 to -0.18, depending on how AI visibility was measured." The author's conclusion: "Pages with good CWV scores did not reliably outperform their peers in AI inclusion, citation, or retrieval," and "Core Web Vitals do not act as a growth lever for AI visibility. They act as a constraint."10
That matches how AI search engines work. They must fetch and read the page, so a slow server or content that appears only after JavaScript runs is a problem (see the 10-minute technical check); once the page is readable, the content decides. Core Web Vitals keep the door open; they do not bring anyone through it.
How does ContentMas help with Core Web Vitals?
ContentMas is an AI-powered SEO tool that audits your website for Google and AI search engines, and shows exactly what to fix to rank higher and get cited. Its Technical Readiness pillar checks the causes described above on every scanned page: whether the main (LCP) image is in the HTML, not lazy-loaded and marked fetchpriority="high"; whether images have a width and height; render-blocking scripts and stylesheets; redirect chains; and server response times. Where the site has enough traffic, it also reads the real-user LCP, INP and CLS figures from the Chrome UX Report at the 75th percentile, for mobile and desktop.
Those checks sit alongside the SEO & GEO Readiness pillar (visibility in Google and AI search engines; GEO means Generative Engine Optimization), Content Quality, Trust & Authenticity, Content Freshness and Security, across 600+ KPIs, each with evidence and a fix ranked by impact. The free plan reads up to 10 pages per scan, 3 scans per 24 hours. See how we score or run an audit.
Key takeaways
- Core Web Vitals are three real-visitor measurements, LCP (loading), INP (responsiveness) and CLS (stability), judged at the 75th percentile of visits, for mobile and desktop separately.1
- Google uses them in ranking, says good scores do not guarantee top positions, and advises against chasing a perfect score for SEO alone.2
- The score out of 100 is a lab test. The Core Web Vitals assessment is 28 days of real-user data, and it passes only if all three metrics are good.6
- LCP fails most often; the LCP element is an image on 76% of mobile pages, and about 16 to 17% of pages lazy-load that image.3
- Fix in this order: the main image, the server and redirects, unsized elements, then tags and scripts. The last step is the one marketing teams control directly.4
Start with the template that turns the most URLs red, check its main image, and give the fix a month to show.
Related reading: Can AI Crawlers Read Your Website? A 10-Minute Technical Check and Which Pages Should a Website Audit Check First?
The six-pillar guides: Technical · Content quality · Trust · Freshness · Security · SEO and GEO · How ContentMas scores each pillar
Frequently asked questions
What is a good Core Web Vitals score?
A page is good when, for 75% of its visits, Largest Contentful Paint is 2.5 seconds or less, Interaction to Next Paint is 200 milliseconds or less, and Cumulative Layout Shift is 0.1 or less.1 Poor is over 4 seconds, over 500 milliseconds and over 0.25, and the band between is "needs improvement."1 The assessment passes only when all three are good.6
Are Core Web Vitals a Google ranking factor?
Yes. Google states that "Core Web Vitals are used by our ranking systems," but also that "Google Search always seeks to show the most relevant content, even if the page experience is sub-par," and that good scores do not guarantee top rankings.2 Treat them as a condition to meet, not a strategy to win with.
Why does PageSpeed Insights give my page 90 but Search Console says it fails?
The score out of 100 is lab data from a simulated device and network; the Core Web Vitals assessment is field data from real Chrome users over the previous 28 days, and Google judges the field data.6 Search Console also groups similar URLs and gives the group the status of its worst metric,1 so one slow template can mark many pages as failing.
How long after a fix do Core Web Vitals improve?
Up to a month. The field data covers a trailing 28-day period,6 and Search Console's validation runs "a 4-week monitoring period of CrUX data" and marks the issue fixed only if no URL shows it during that window.1 Lab tools show the change immediately, which is how a developer confirms the fix landed.
Which Core Web Vital should a small business fix first?
LCP, and specifically the main image on the page. It is the metric most sites fail,37 the LCP element is an image on 76% of mobile pages,3 and the usual fixes are removing loading="lazy" from that image and adding fetchpriority="high".4 Then check redirects on campaign links, unsized images, and the tags in the tag manager.4
References
Each numbered marker in the article links to its source below.
-
Google Search Console Help — Core Web Vitals report (opens in a new tab), accessed November 2026. ↩
-
Google Search Central — Understanding page experience in Google Search results (opens in a new tab), September 2026. ↩
-
HTTP Archive — The 2025 Web Almanac: Performance (opens in a new tab), January 2026. ↩
-
web.dev — The most effective ways to improve Core Web Vitals (opens in a new tab), October 2024. ↩
-
Google Search Central — Understanding Core Web Vitals and Google search results (opens in a new tab), December 2025. ↩
-
Google for Developers — About PageSpeed Insights (opens in a new tab), October 2024. ↩
-
Chrome for Developers — Chrome UX Report release notes (opens in a new tab), November 2026. ↩
-
web.dev — Optimize Largest Contentful Paint (opens in a new tab), March 2025. ↩
-
web.dev — How Nuvemshop's image prioritization strategy led to a 68% improvement in LCP and 8.9% more conversions (opens in a new tab), June 2026. ↩
-
Search Engine Land — What 107,000 pages reveal about Core Web Vitals and AI search (opens in a new tab), accessed November 2026. ↩
About this article
Written by Nasir Ali Joiya. Nasir Ali Joiya is a software engineer and the CEO and Co-Founder of ZAPTA Technologies, an AI-native software company in Lahore whose group has more than 150 engineers. Reviewed by the ContentMas Team, who build ContentMas, an AI-powered SEO audit tool that checks sites across six pillars for Google and AI search engines. Facts and figures link to their original sources in the References. Spotted something out of date? Tell us and we will correct it.
Free website audit
See how your site scores for search engines and AI assistants.
One score, six pillar scores and a ranked fix list in a few minutes. No credit card.
Start free audit